Last Forty Years of ITE Journal Articles: A Scientometric Overview
By Subasish Das (Texas A&M Transportation Institute) and Hamsa Zubaidi (Oregon State University)
ITE Journal (ISSN 0162-8178), published by the Institute of Transportation Engineers (ITE), publishes twelve issues per year. Since its first publication in 1930, ITE Journal has been a prominent periodical in transportation industry. According to ITE Journal, “this journal is written by and for transportation engineers, transportation planners, and others responsible for the safe and efficient movement of people and goods on our surface transportation system.” Understanding research trends in popular science journal is important. Scientometric and bibliographic methods on a specific journal provide intuitive knowledge regarding the publication trends and scopes in the form of quantitative measures of the topics and keywords. In the recent years, several top transportation journals such as Accident Analysis and Prevention, Safety Science, and Journal of Transport Geography published scientometric and bibliometric studies on their journals.1-4 These articles provide key insights about the publication trends of these journals, which are usually hard to attain without substantial efforts.
It is important to note that the audience of ITE Journal articles are the general readers with or without transportation science or engineering background. Majority of these articles are limited to 2,000 to 3,000 word counts and the authors present the articles without providing in-depth theoretical or methodological details. We performed a scientometric and bibliometric analysis of ITE Journal articles (1978 to 2019) in this report.
Data Collection
Web of Science (WoS), an online subscription-based scientific citation indexing service, offers a thorough citation search based on the keywords, authors and other associated information. It delivers access to many major scientific databases and encompasses over 148 million records (journals, books, and proceedings) that date back to the beginning of the 20th century. We selected WoS as the source database to obtain the data. The final database contains 2,346 documents within the time period of 1978 to 2019. The average citation per document is 1.67. These documents contain 6,574 references. There are 2,900 contributing authors. Around 70 percent of these articles are multi-authored. The number of documents per author is 0.81, and the number of authors per article is 1.24. The number of articles per year ranges from 32 to 81. The highest number of publications is seen in 1992. In the recent years, yearly fifty articles are usually published by this journal. The average article citations per year ranges from 0.15 to 0.30 in the recent years.
Figure 1. Annual scientific production and average article citations.

Analytical Methods
Bibliometrics provides vibrant, evaluative, and predictive scientometric analysis. It has been originated from the library and information science field; however, it has been generally accepted and integrated for use in many other disciplines, especially for quantitative analyses by researchers, institutes, and journals based on academic outputs. Many programming tools and packages, such as BibExcel, CiteSpace, Pajek, Gephi, Vos Viewer, and Histcite, have been created to conduct the bibliometric process. We used VOSviewer in developing visualization and bibliometric maps.5 This software utilizes a unified framework for mapping and clustering, and it is primarily used for the analysis of bibliometric networks. VOSviewer can produce three types of visualizations: density visualizations, overlay visualizations, and network visualizations. We also used the R package ‘Bibliomatrix’ to perform additional analysis.6
Top Contributions
Table 1 shows the top 10 contributions made by countries, institutes, and authors. The United States dominates in the number of publications with a total of 1,285 ITE Journal publications and is followed by Canada (103 publications) and Australia (23 publications). The top three universities with a high number of ITE Journal publications are the Texas A&M University (38 publications), Purdue University (33 publications), and University of Central Florida (30 publications). M. Birdsall (senior editor of ITE Journal during 2006-2018) leads the list of the authors with 37 publications and is followed by K. Fitzpatrick (16 publications), and N. Lalani (16 publications).
Table 1. Top 10 contributions of countries, institutes and authors.
|
No. |
Country |
Freq* |
Institute |
Freq |
Authors |
Freq |
|---|---|---|---|---|---|---|
|
1 |
USA |
1285 |
Texas A&M Univ** |
38 |
Birdsall, M. |
37 |
|
2 |
Canada |
103 |
Purdue Univ |
33 |
Fitzpatrick, K. |
16 |
|
3 |
Australia |
23 |
Univ Cent Florida |
30 |
Lalani, N. |
16 |
|
4 |
China |
12 |
Univ Washington |
24 |
Retting, R. |
12 |
|
5 |
Netherlands |
12 |
Univ Tennessee |
21 |
Beaubien, E. |
11 |
|
6 |
United Kingdom |
12 |
Arizona State Univ |
18 |
Norman, M. |
11 |
|
7 |
Greece |
7 |
Univ Maryland |
18 |
Stokes, R. |
11 |
|
8 |
Japan |
7 |
Univ S Florida |
18 |
Kraft, W. |
10 |
|
9 |
Jordan |
7 |
Florida Int Univ |
17 |
Abdel-Aty, M. |
9 |
|
10 |
Singapore |
7 |
Univ Nevada |
17 |
Chatterjee, A. |
9 |
Note:* Freq= Frequency, **Univ= University
Table 2 lists the top ten articles with the highest number of total citations (TC). The top article ‘Real-Time Travel Time Estimates using Media Access Control Address Matching,’ which was published in 2008, has a total of 88 citations with 6.77 citations per year. Two ITE Journal articles by T. Litman in 2003 and 2001 are listed in the top ten cited articles with total of 86 and 47 citations and 4.78 and 2.35 citations per year respectively. J. Lindley listed in the third place with 84 citation with 2.47 citations per year for the paper, “Urban Freeway Congestion - Quantification of The Problem and Effectiveness of Potential Solutions.”
Table 2. Top 10 cited articles in ITE Journal.
|
No. |
First Author |
Year |
Title |
TC |
TC/Y |
|---|---|---|---|---|---|
|
1 |
Wasson, J.7 |
2008 |
Real-Time Travel Time Estimates using Media Access Control Address Matching |
88 |
6.77 |
|
2 |
Litman, T.8 |
2003 |
Measuring Transportation: Traffic, Mobility and Accessibility |
86 |
4.78 |
|
3 |
Lindley, J.9 |
1987 |
Urban Freeway Congestion -- Quantification of the Problem and Effectiveness of Potential Solutions |
84 |
2.47 |
|
4 |
Wachtel, A.10 |
1994 |
Risk-Factors for Bicycle Motor-Vehicle Collisions at Intersections |
69 |
2.56 |
|
5 |
Retting, R.11 |
1999 |
Evaluation of Red-Light Camera Enforcement in Fairfax, VA, USA |
50 |
2.27 |
|
6 |
Alexiadis, V.12 |
2004 |
The Next Generation Simulation Program |
49 |
2.88 |
|
7 |
Taoka, G.13 |
1989 |
Brake Reaction-Times of Unalerted Drivers |
49 |
1.53 |
|
8 |
Litman, T.14 |
2001 |
Generated Traffic: Implications for Transport Planning |
47 |
2.35 |
|
9 |
Akcelik, R.15 |
1988 |
The Highway Capacity Manual Delay Formula for Signalized Intersections |
46 |
1.39 |
|
10 |
Zegeer, C.16 |
1978 |
Green-Extension Systems at High-Speed Intersections |
44 |
1.02 |
Co-occurrence Measures
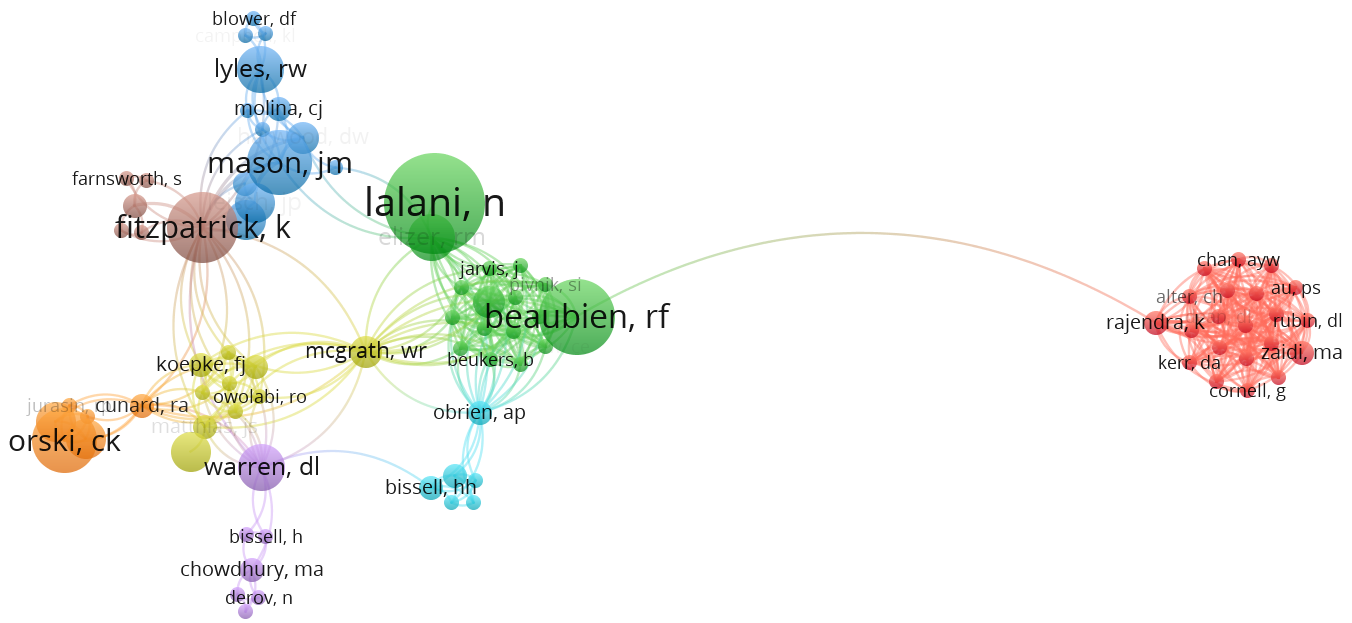
Figure 2a shows a network visualization map of author collaborations. In the network visualizations, items are labelled and represented by a circle. The circles are shown in different sizes, which are determined by the count of the given item. The items are placed on the map based on their clusters. The colors of the items are also based on the item’s cluster. On the visualization, the lines between the items represent the relationship between the items. The stronger the connection is, the thicker the line. Furthermore, the distance between items in the map represents the level of relatedness between them. The relatedness of authors is determined based on their number of co-authored publications. Authors with a minimum of four co-authorship publications are visualized, resulting in a total of 86 authors (21 clusters; networks and circles are coloured based on the clusters). The bigger the size of the node the influential the author is. Key influential authors include K. Fitzpatrick, N. Lalani, R. Beaubien, J. Mason, and C. Orski. It is also seen that R. Beaubien has a distant link with K. Rajendra, who collaborated with a group of authors (showed in red nodes and links).
Figure 2b illustrates a network visualization map of author collaborations by institutes. Authors with a minimum of two co-authorship publications are visualized, resulting in a total of 124 institutes (15 clusters). Some of the institutes with large nodes are ITE, Federal Highway Administration (FHWA), Transportation Research Board (TRB), University of Nevada, Fehr & Peers, Purdue University, HNTB Corp., Portland State University, University of Central Florida, University of Tennessee, University of Washington, and Texas A&M University.


Figure 2. Network visualization map of collaborations.
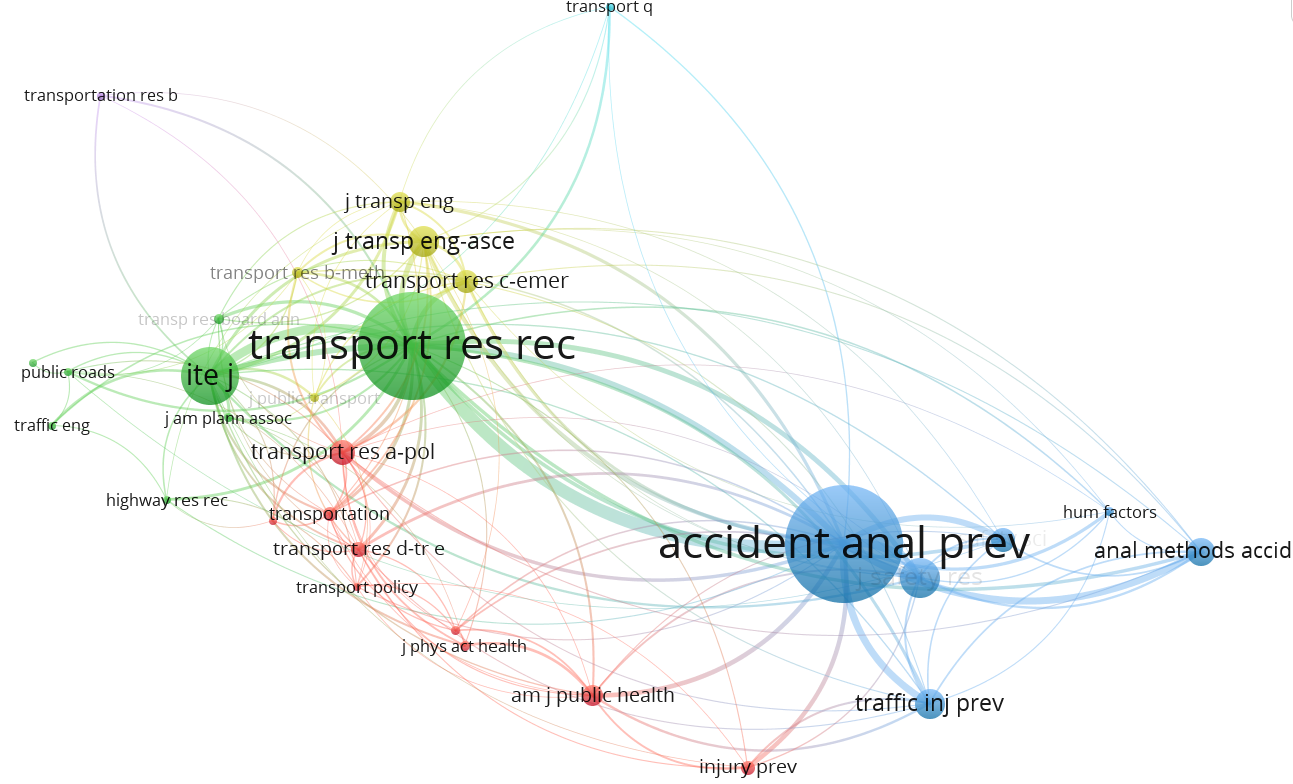
Figure 3 shows a network visualization map of co-citations by the journals. Journals with a minimum of four co-citations are visualized, resulting in a total of 75 journals. At least three journals are dominating in co-citations with the large three circles with ITE Journal, Accident Analysis & Prevention, and Transportation Research Record. Transportation Research Record shows strong links with both ITE Journal and Accident Analysis & Prevention.

Figure 3. Visualizations map of co-citations by the journals.
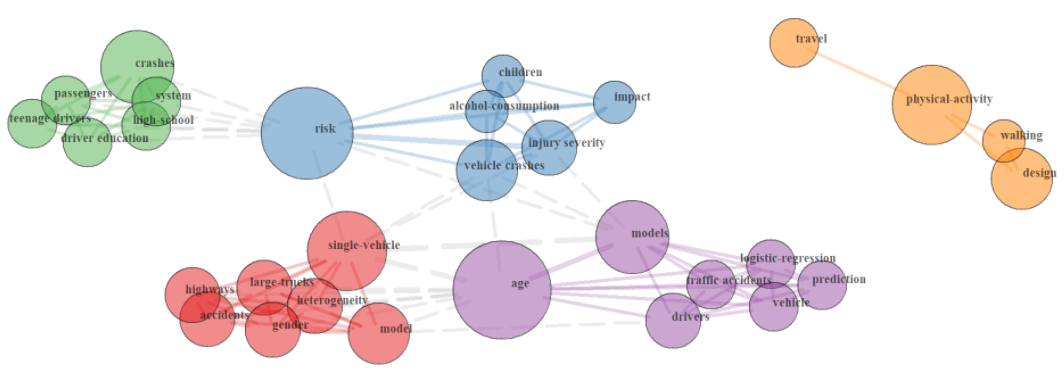
Figure 4 shows a network plot of the author denoted keywords. Five different clusters are shown in the Figure. These clusters are: driver education (associated with driver education, teenage drivers, high school, passenger, system, and crashes) in green circles, impairment (associated with alcohol consumption, injury severity, vehicle crashes, impact, children, and risk) in blue circles, walking (associated with walking, design, physical activity, and travel) in orange circles, modelling (associated with drivers, logistic regression, prediction, vehicle, traffic accidents, drivers, and age) in purple circles and single vehicle and truck crashes (associated with single vehicle, large trucks, gender, accidents, highways, model, and heterogeneity) in red circles. The clusters indicate that safety related topics and keywords were frequently present in the last forty years of ITE Journal articles.

Figure 4. Network plot of author denoted keywords.
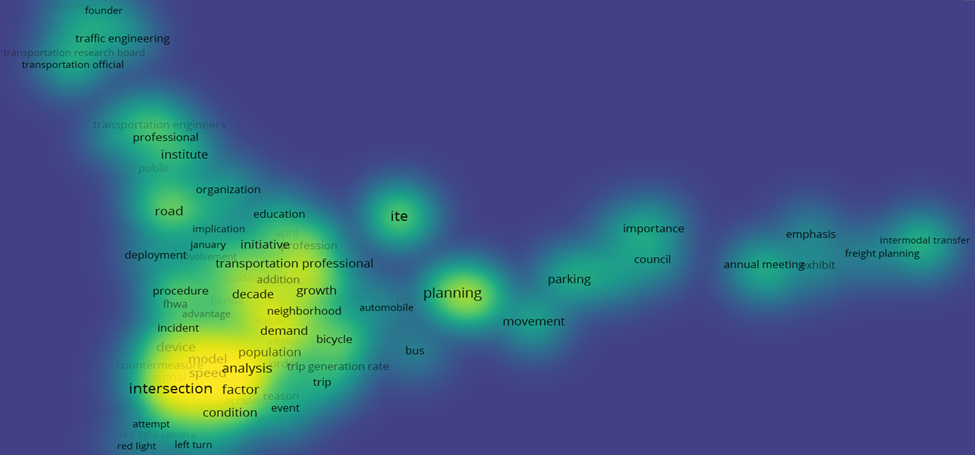
Figure 5 illustrates the heatmap of the co-occurrences of the keywords from abstracts of ITE Journal articles. As abstracts are not limited to keywords only, additional text mining steps such as ‘stop word’ removal, number and punctuation removal, and lemmatization (different inflected forms of words to be considered as single word) were conducted before performing the clustering. Keywords with a minimum of 5 occurrences (based on the count of the mutual occurrences in analyzed abstracts) are visualized, resulting in a total of 337 keywords out of 5,875 keywords. Yellow color represents the density of the co-occurrences. Some of the keywords with high density are intersection, model, factor, analysis, population, countermeasure, demand, transportation professional, traffic engineering, ITE, planning, education, movement, parking, importance, council, emphasis, freight planning, and intermodal transfer. The density plots of the keywords indicate that ITE Journal covers a wide range of topics associated with transportation science and engineering.

Figure 5. Clusters of keywords from titles and abstracts.
ITE Journal is a cross disciplinary journal that publishes a wide range of articles and features focusing on multi-disciplinary topics that are related to transportation industry. Some of the major topics in the published ITE Journal articles are roadway safety, infrastructure, human factors, emerging countermeasures, planning, education and training, trip generation, and non-motorist safety. We explored 2,346 ITE Journal articles to identify cooccurrence of keywords, citation patterns, top cited articles and authors with dominance factors. The results indicated that USA, Canada, and Australia are the top three countries with the highest number of ITE publications respectively. Texas A&M University, Purdue University and University of Central Florida are the top three universities with a high number of publications. Additionally, clusters of keywords show the trends of the topics covered in this widely circulated journal and most of them covers a wide range of topics associated with transportation science and engineering.
REFERENCES
- Zou X, Vu HL. Mapping the knowledge domain of road safety studies: A scientometric analysis. Accident Analysis & Prevention. 2019; 132:105243.
- Zou X, Vu HL, Huang H. Fifty Years of Accident Analysis & Prevention: A Bibliometric and Scientometric Overview. Accident Analysis & Prevention. 2020; 144:105568.
- Sarkar S, Maiti J. Machine learning in occupational accident analysis: A review using science mapping approach with citation network analysis. Safety Science. 2020; 131:104900.
- Merigó JM, Miranda J, Modak NM, Boustras G, de la Sotta C. Forty years of Safety Science: A bibliometric overview. Safety Science. 2019; 115:66–88.
- van Eck, N. J., & Waltman, L. Software survey: VOSviewer, a computer program for bibliometric mapping. Scientometrics. 2010; 84: 523–538.
- Aria, M., and Cuccurullo, C. bibliometrix: AnR-tool for comprehensive science mapping analysis, Journal of Informetrics. 2017; 11(4): 959-975.
- Wasson, J. S., J. R. Sturdevant, and D. M. Bullock. Real-Time Travel Time Estimates Using Media Access Control Address Matching. ITE Journal, Vol. 78, No. 6, 2008.
- Litman, T. Measuring Transportation: Traffic, Mobility and Accessibility. ITE Journal, Vol. 73, No. 10, 2003.
- Lindley, J. A. Urban Freeway Congestion - Quantification of The Problem and Effectiveness of Potential Solutions. ITE Journal, Vol. 57, No. 1, 1987.
- Wachtel, A., and D. Lewiston. Risk-Factors for Bicycle Motor-Vehicle Collisions at Intersections. ITE Journal, Vol. 64, No. 9, 1994.
- Retting, R. A., A. F. Williams, C. M. Farmer, and A. F. Feldman. Evaluation of Red-Light Camera Enforcement in Fairfax, VA, USA. ITE Journal, Vol. 69, No. 8, 1999.
- Alexiadis, V., J. Colyar, J. Halkias, R. Hranac, and G. McHale. The next Generation Simulation Program. ITE Journal, Vol. 74, No. 8, 2004.
- Taoka, G. T. Brake Reaction Times of Unalerted Drivers. ITE Journal, Vol. 59, No. 3, 1989.
- Litman, T. Generated Traffic: Implications for Transport Planning. ITE Journal, Vol. 71, No. 4, 2001.
- Akcelik, R. The Highway Capacity Manual Delay Formula for Signalized Intersections. ITE Journal, Vol. 58, No. 3, 1988.
- Zegeer, C. V., and R. C. Deen. Green-Extension Systems at High-Speed Intersections ITE Journal, Vol. 48, No. 11, 1978.
Author Bios
Subasish Das, Ph.D. is an Assistant Research Scientist with Texas A&M Transportation Institute in San Antonio, TX, USA. His major areas of expertise include statistical analysis and machine learning with an emphasis in transportation safety and operations, spatial analysis with web GIS tools, interactive data visualization, and deep learning for CV/AV technologies. He has published more than hundred peer-reviewed journal articles, reports, and book chapters. He is the author of the book ‘Artificial Intelligence in Transportation Safety,’ which will be published by CRC Press in 2021.
Hamsa Zubaidi is a Ph.D. Candidate of Civil and Construction Engineering Department at Oregon State University. She is expert at applying advanced econometric techniques, GIS tools, and machine learning algorithms in transportation research problems. She has published several peer-reviewed journal articles in the top transportation journals